In the Log Level Management menu item, you can adjust log levels for specific adapters based on time or rules. For example, you can switch the log level of an adapter to debug for a short period and automatically revert back to info.
These are the typical use cases:
Temporary debugging: Set the debug level to troubleshoot issues for 10 minutes, then automatically revert to the normal level.
Scheduled monitoring: Set log levels to debug during critical periods, such as partner file transfers on weekends.
Open the Log Inspector app.
Open the Log Level Management menu item.
Click New.
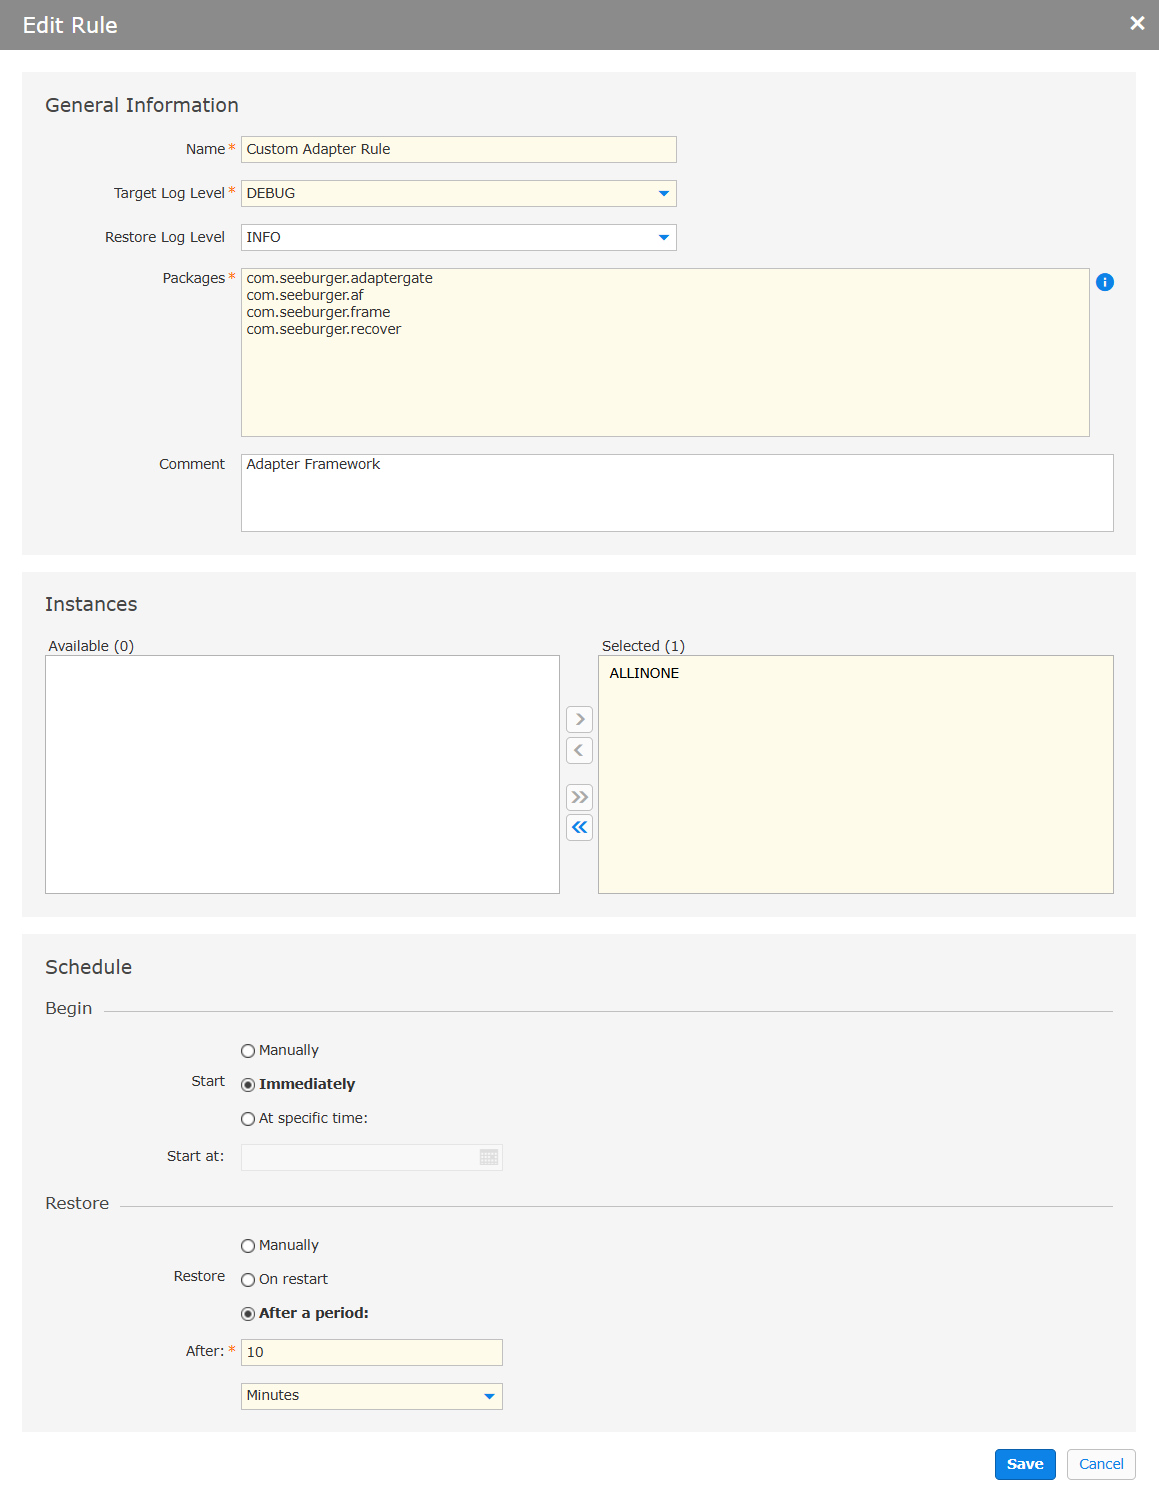
In the General Information section, you can write a name for the rule, set log levels, and write down packages. You can also add a comment.
In the Instances section, you can select and deselect instances.
In the Schedule section, you can specify the log level rules to your needs, such as troubleshooting issues or monitoring during critical periods.
Click Save.
Open the Log Inspector app.
Open the Log Level Management menu item.
Click your preferred log level rule.
Click Edit.
In the General Information section, you can edit the name, log levels, and packages. You can also add a comment.
In the Instances section, you can select and deselect instances.
In the Schedule section, you can specify the log level rules to your needs, such as troubleshooting issues or monitoring during critical periods.
Click Save.